Welcome to the Rekt Capital newsletter, a place for people who want to better navigate the crypto markets with the help of cutting-edge crypto research and unbiased market analysis.
In today’s newsletter we’ll focus on the positives in Bitcoin’s price action as well as my concerns.
Bitcoin - The Positives
The Macro Higher Low
The first positive technical aspect about price is the Macro Higher Low (black).
BTC is still holding support here and the most recent Weekly Close has occurred above the HL, despite downside wicking below it late last week.
This Higher Low support still remains a crucial support, as it has been since mid-2021.
Would losing this HL be completely bearish?
Of course price would decline after losing it, first into the ~$35k region and then the most notable area would be the green demand area; but a potential loss of the HL wouldn’t be completely bearish because it is the green demand area that needs to continue holding for price to maintain macro bullish momentum.
Because after all - BTC is consolidating between the $28000 Range Low and $69000 Range High.
Theoretically, anything inside the range is noise.
When BTC breaks down from the green Range Low - BTC will confirm a bearish macro trend.
When BTC breaks out beyond the red Range High - BTC will confirm a bullish macro trend.
However, in the meantime - the Macro Higher Low continues to hold.
This HL in general is a good illustration of bull-side momentum relative to the green Range Low.
That is, buyers are happy to buy BTC at a premium now compared to mid-2021.
So I’m bullish as long as this trendline holds.
Conversely, losing this HL would be an invalidation of bullish momentum and price would drop closer towards the green Range Low, but macro-wise this sort of move for BTC would still signify consolidation inside $28000-$69000.
The Weekly S/R Flip
Notice how the Macro Higher Low is confluent support with the green horizontal Weekly support.
And notice how this green support is holding price up compared to when this very same level used to reject price earlier this year.
Thus, this level has switched from an old resistance into a new support.
As long as it continues to hold as support - I’m bullish.
The Volume Gap
The Macro Higher Low and the Weekly horizontal support also find confluence with the bottom of the Volume Gap.
The Volume Profile suggests BTC has reached a densely-populated area of buy-side interest, based on historically transacted volume in this price region.
BTC could fill the vacuum inside the Volume Gap but BTC needs to hold this orange area/Higher Low for price to have a chance at doing so.
Thus price-strength confirmation is key for BTC going forward.
The Monthly Ichimoku Kijun-Sen
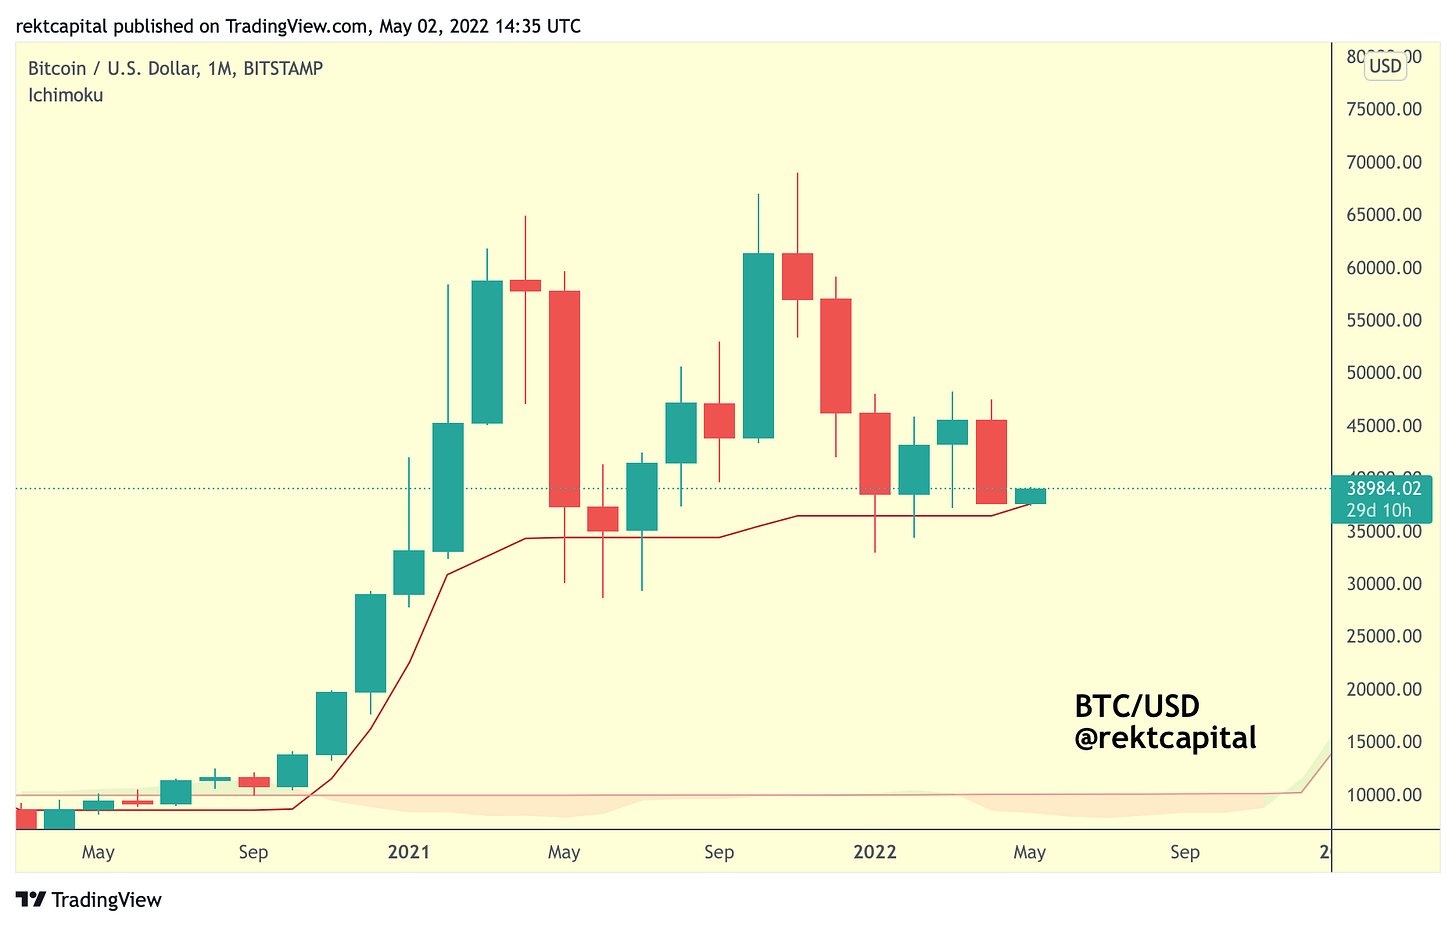
The Monthly Kijun-Sen is a great reference point for Bull and Bear trends.
Bear Trends occur when the Kijun acts as resistance or support is lost.
Bull Trends occur when the Kijun acts as support.
Here’s an update:
Right now, the Kijun is still acting as support.
In fact, BTC recently tagged this Kijun which in itself has recently flicked up.
As long as the Kijun holds, BTC is bull-biased.
Summary of All The Positives
In short - it all comes down to the Monthly Kijun holding as support.
The Macro Higher Low is also very important, but there is a scope for a scenario where BTC briefly loses the HL but manages a Monthly Close later this month above the Kijun, thus registering a downside wick on the Monthly. Wicks below the Kijun have happened before, after all.
In any case, the HL and the Monthly Kijun are what I’m watching for bullish momentum to remain sustained.


