

Is The Bitcoin Cycle Lengthening? Part 2
Is The Bitcoin Cycle Lengthening? Part 2
My Perspective - Bitcoin Halving Analysis

Welcome to the Rekt Capital newsletter, a resource for people who want to better navigate the crypto markets with the help of cutting-edge crypto research and unbiased market analysis.
I write research articles just like this one every Monday and Wednesday for subscribers of the Rekt Capital newsletter. Friday’s feature TA on a wide-variety of Altcoins.
Today’s edition is free for everybody to read.
If you’d like to receive cutting-edge research like this straight to your inbox - feel free to subscribe for $14 a month:

More Lengthening?
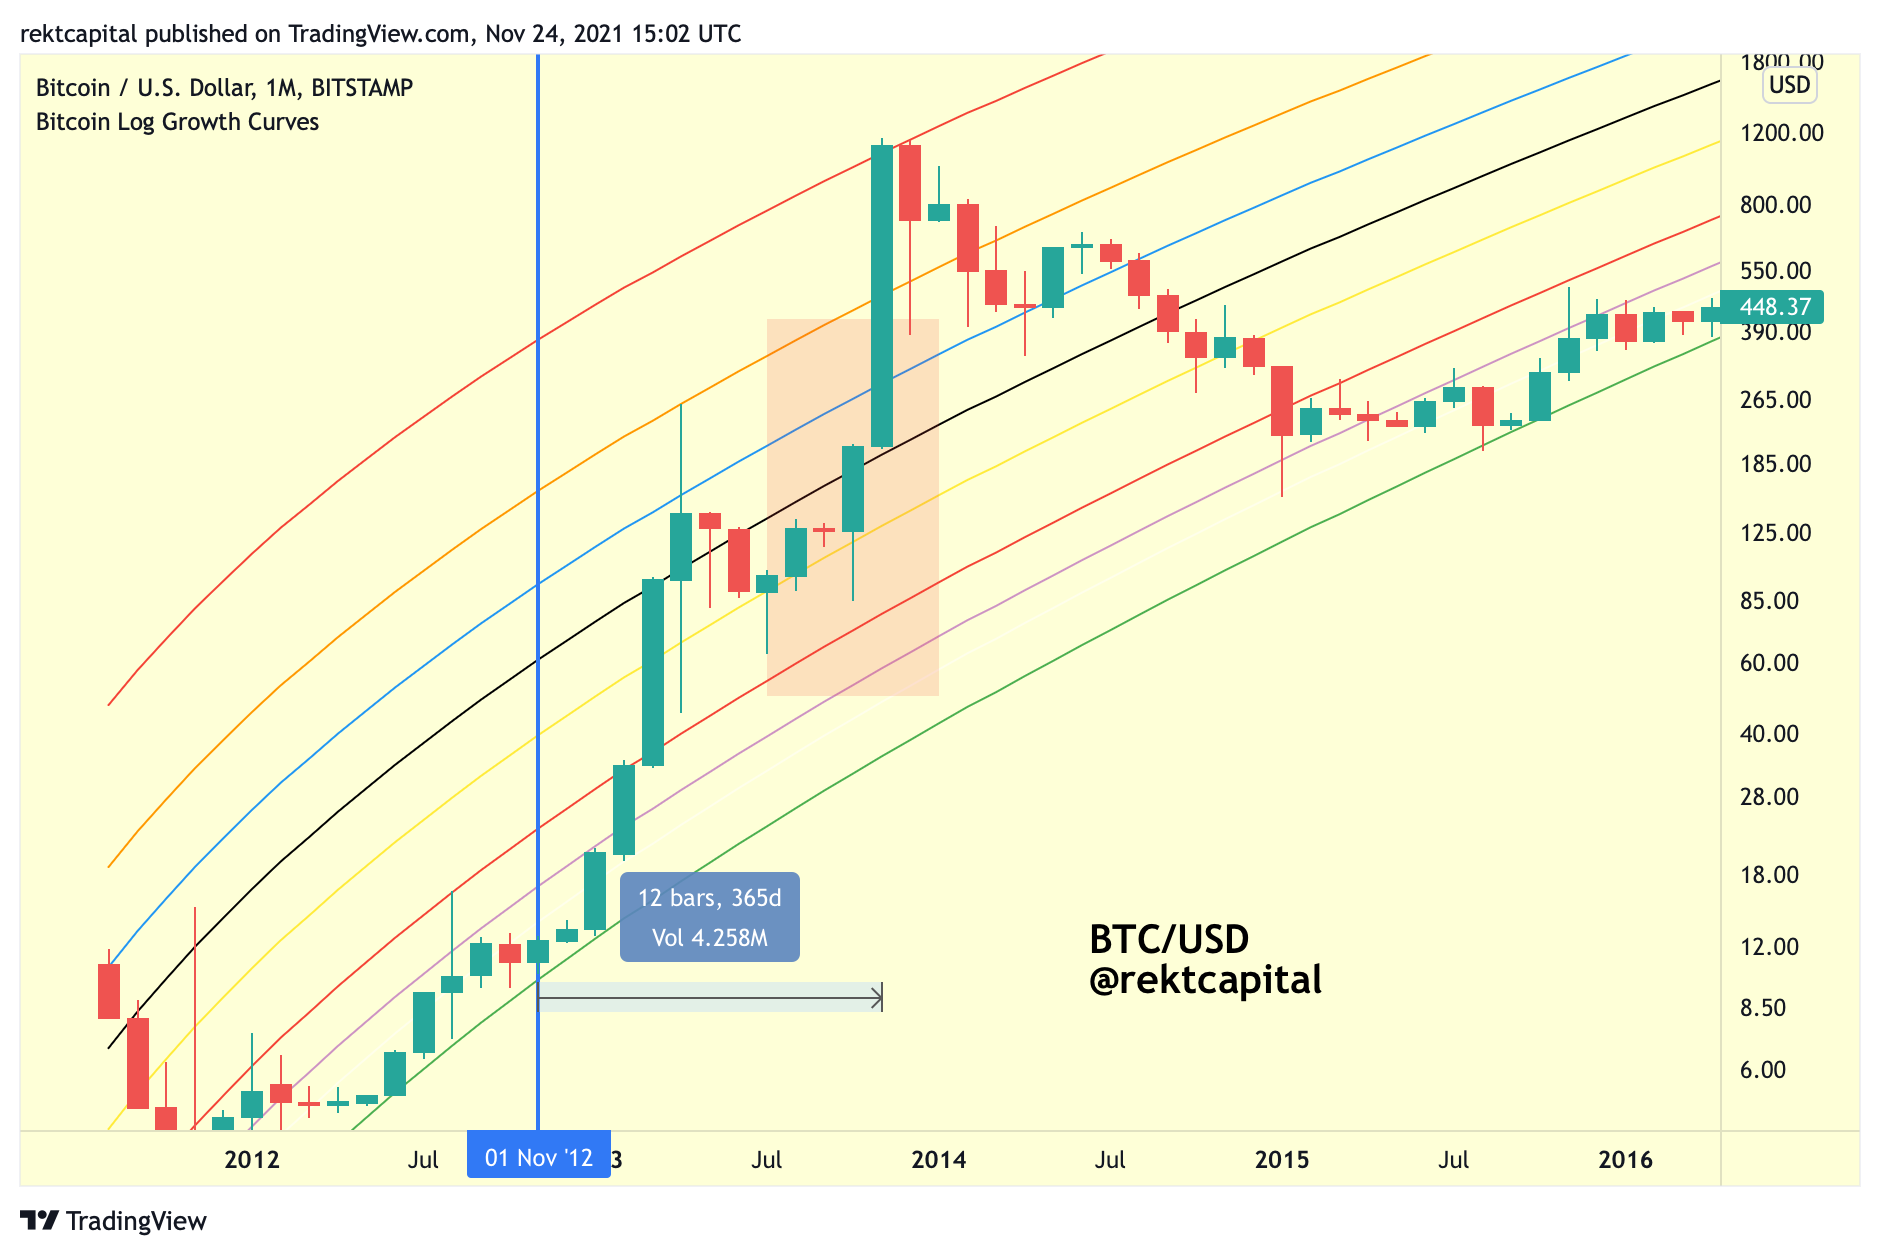
Let’s now look at the lengthening in terms of the actual retest of the black 0.5 Fib Curve support itself.
Once the 2013 retest of the black 0.5 Fib Curve was complete - it took BTC very little time to actually rally to the very top of the Bitcoin Log Growth Curve channel to peak in its Bull Market:
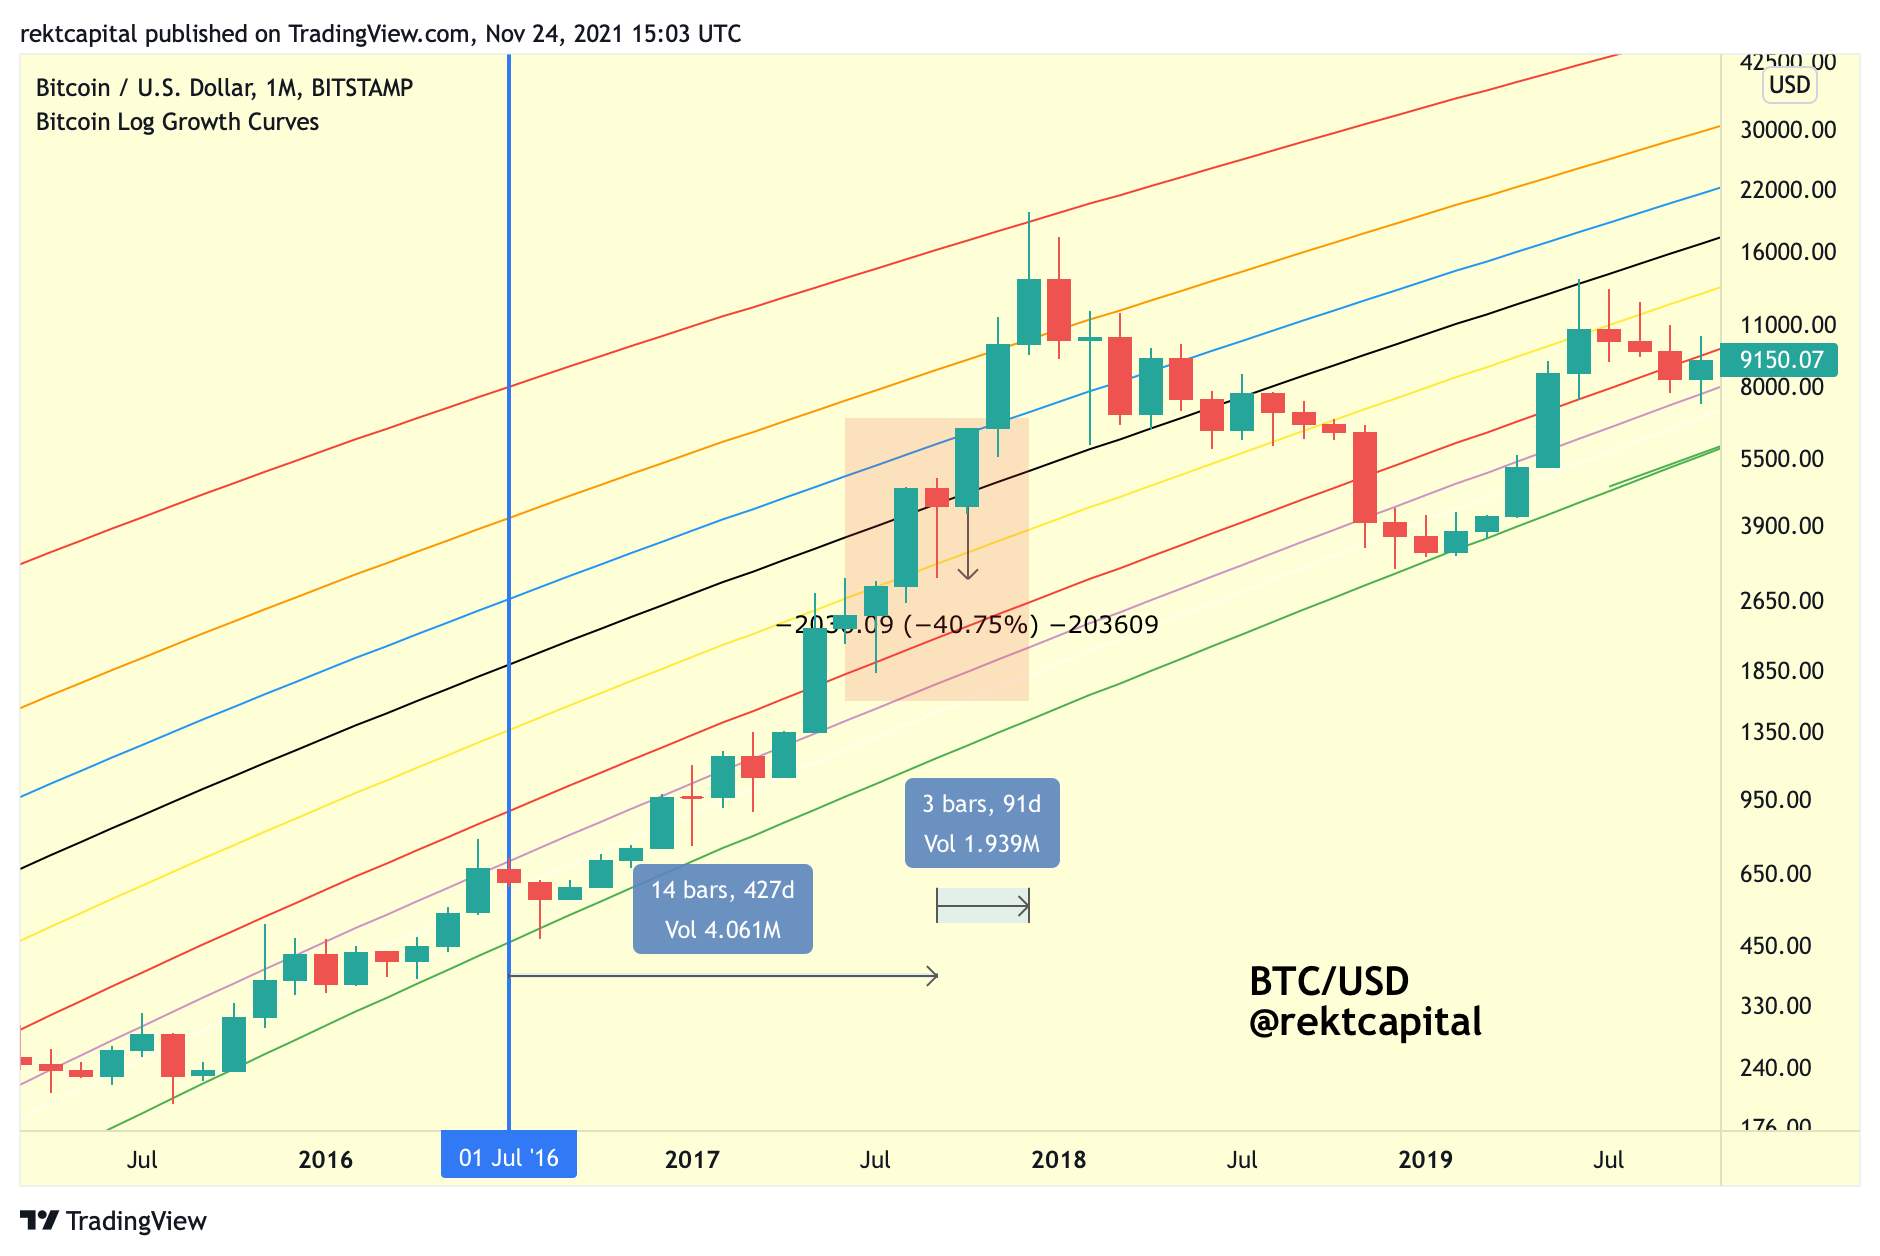
In 2017 however, it took Bitcoin around 3 months (91 days) to rally to the top of the Growth Curve Channel after a successful retest of the black 0.5 Fib Curve as new support.
What about in this cycle?
Could it be that the amount of time that it takes BTC to rally to the top of the channel actually lengthens, compared to what has happened in the past?
It’s possible, but it’s difficult to say at this stage.
Here’s what we can say however:
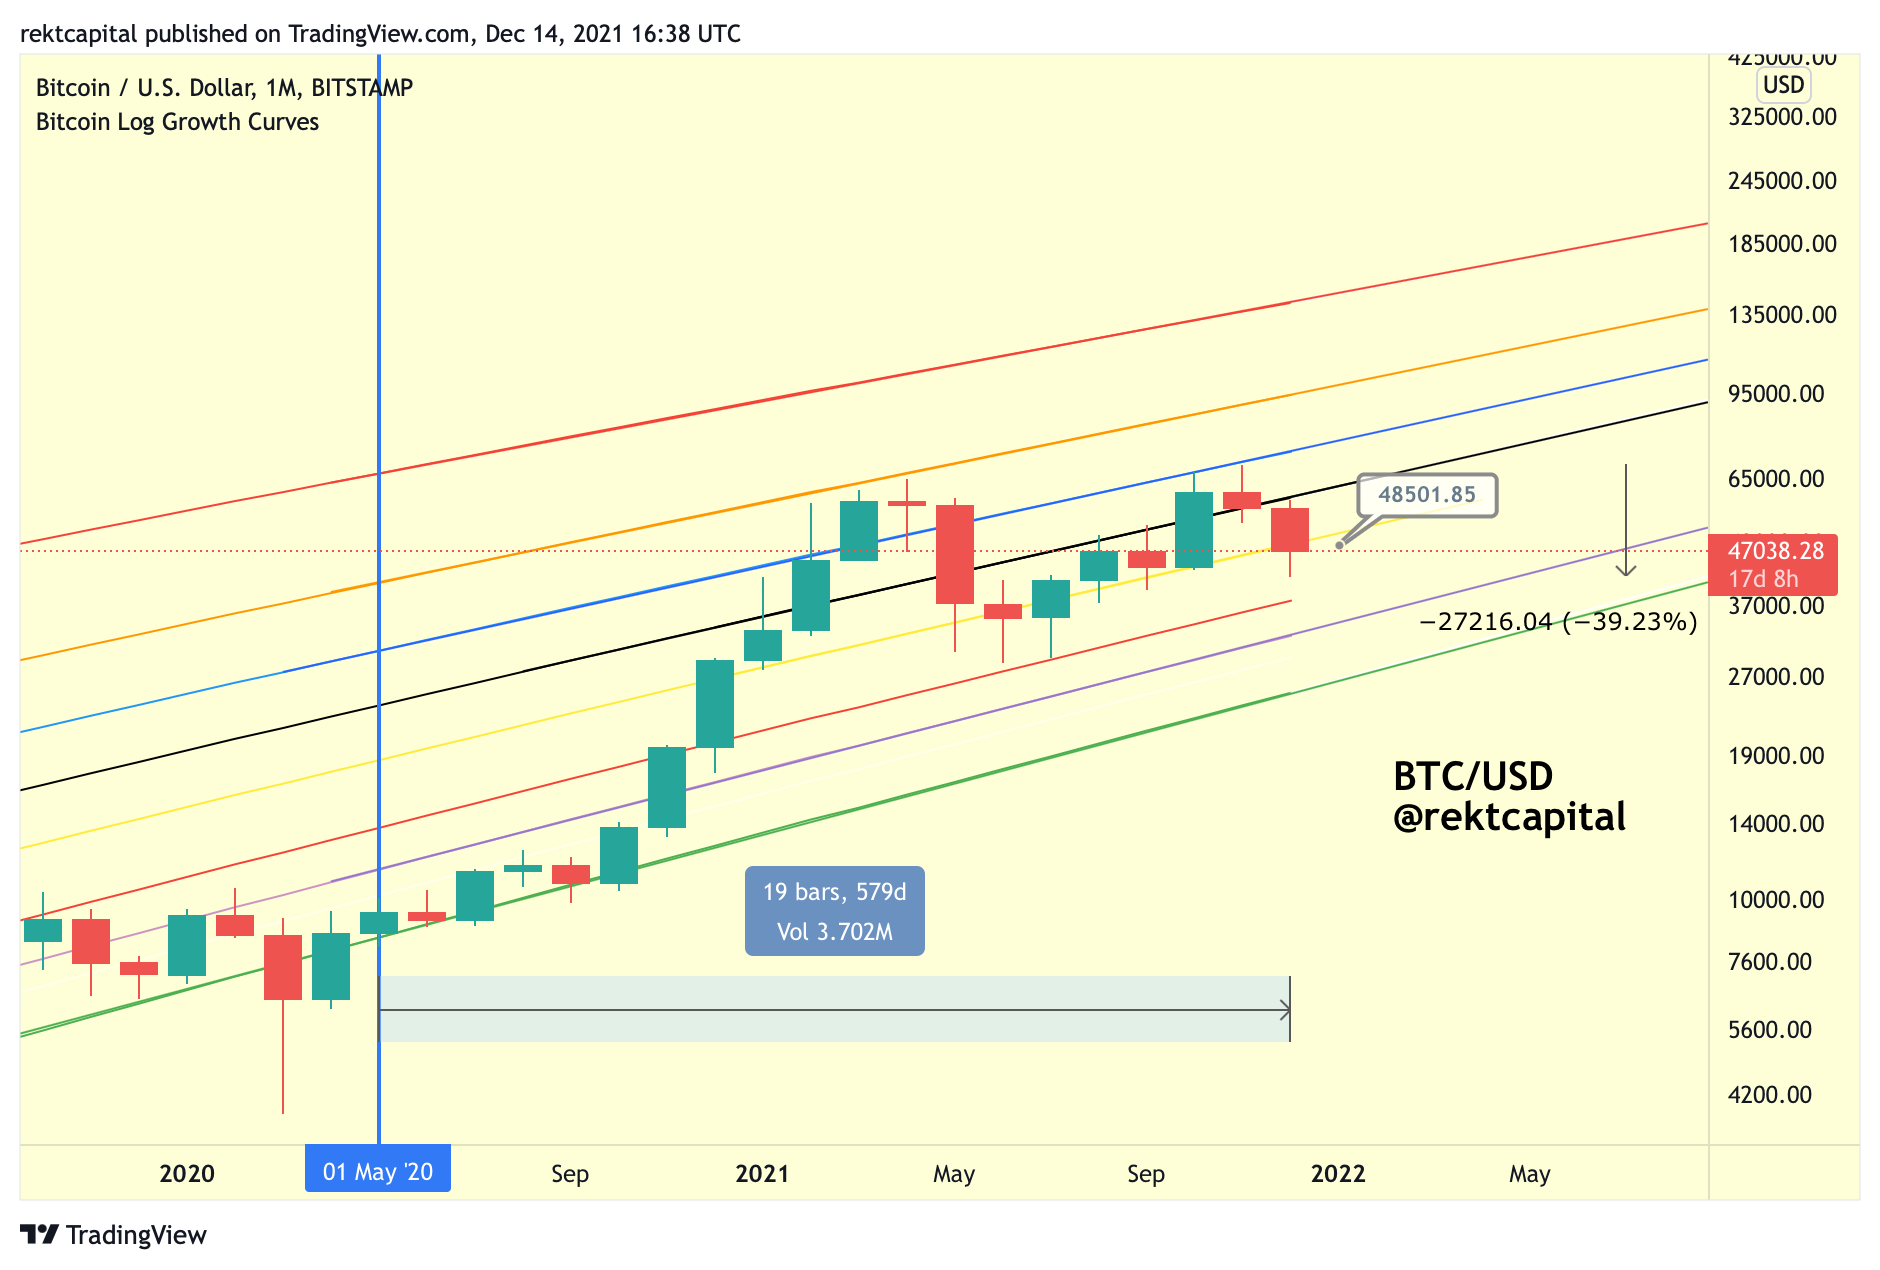
This post-Halving #3 cycle has lengthened considerably, with Bitcoin still meandering at current price levels almost 380 days after the Halving.
Interestingly, Bitcoin has retraced -39% since rejecting in the ~$69000 region.
This is a similar retracement amount to what we saw in 2017 when BTC retraced -40% at a similar point in the cycle.
In fact, in 2017 Bitcoin retraced -40% into the yellow 0.382 Fib Curve support for a retest attempt.
Bitcoin is actually doing the same thing right now; that is, BTC is down -39% and is currently in the process of retesting the yellow 0.382 Fib Curve as support.
But one of the thing to maintain for the future is this - at which point will Bitcoin perform a retest of the black 0.5 Fib Curve? Because a retest of this Fib is needed to ensure parabolic upside to the top of the channel.
And when this retest is in progress - how long will Bitcoin take to rally to the top of the log channel?
Because it took BTC only a few weeks in 2013 to rally to the top of the channel after retesting the black 0.5 Fib.
It took BTC 90 days or so in 2017 to rally to the top of the channel after retesting the black 0.5 Fib.
Could it be that we will also see lengthening in the amount of time it takes for BTC to rally to the top of the channel following a successful retest of the black 0.5 Fib as support?
It’s quite possible but we’re looking too ahead into the future for the time being.
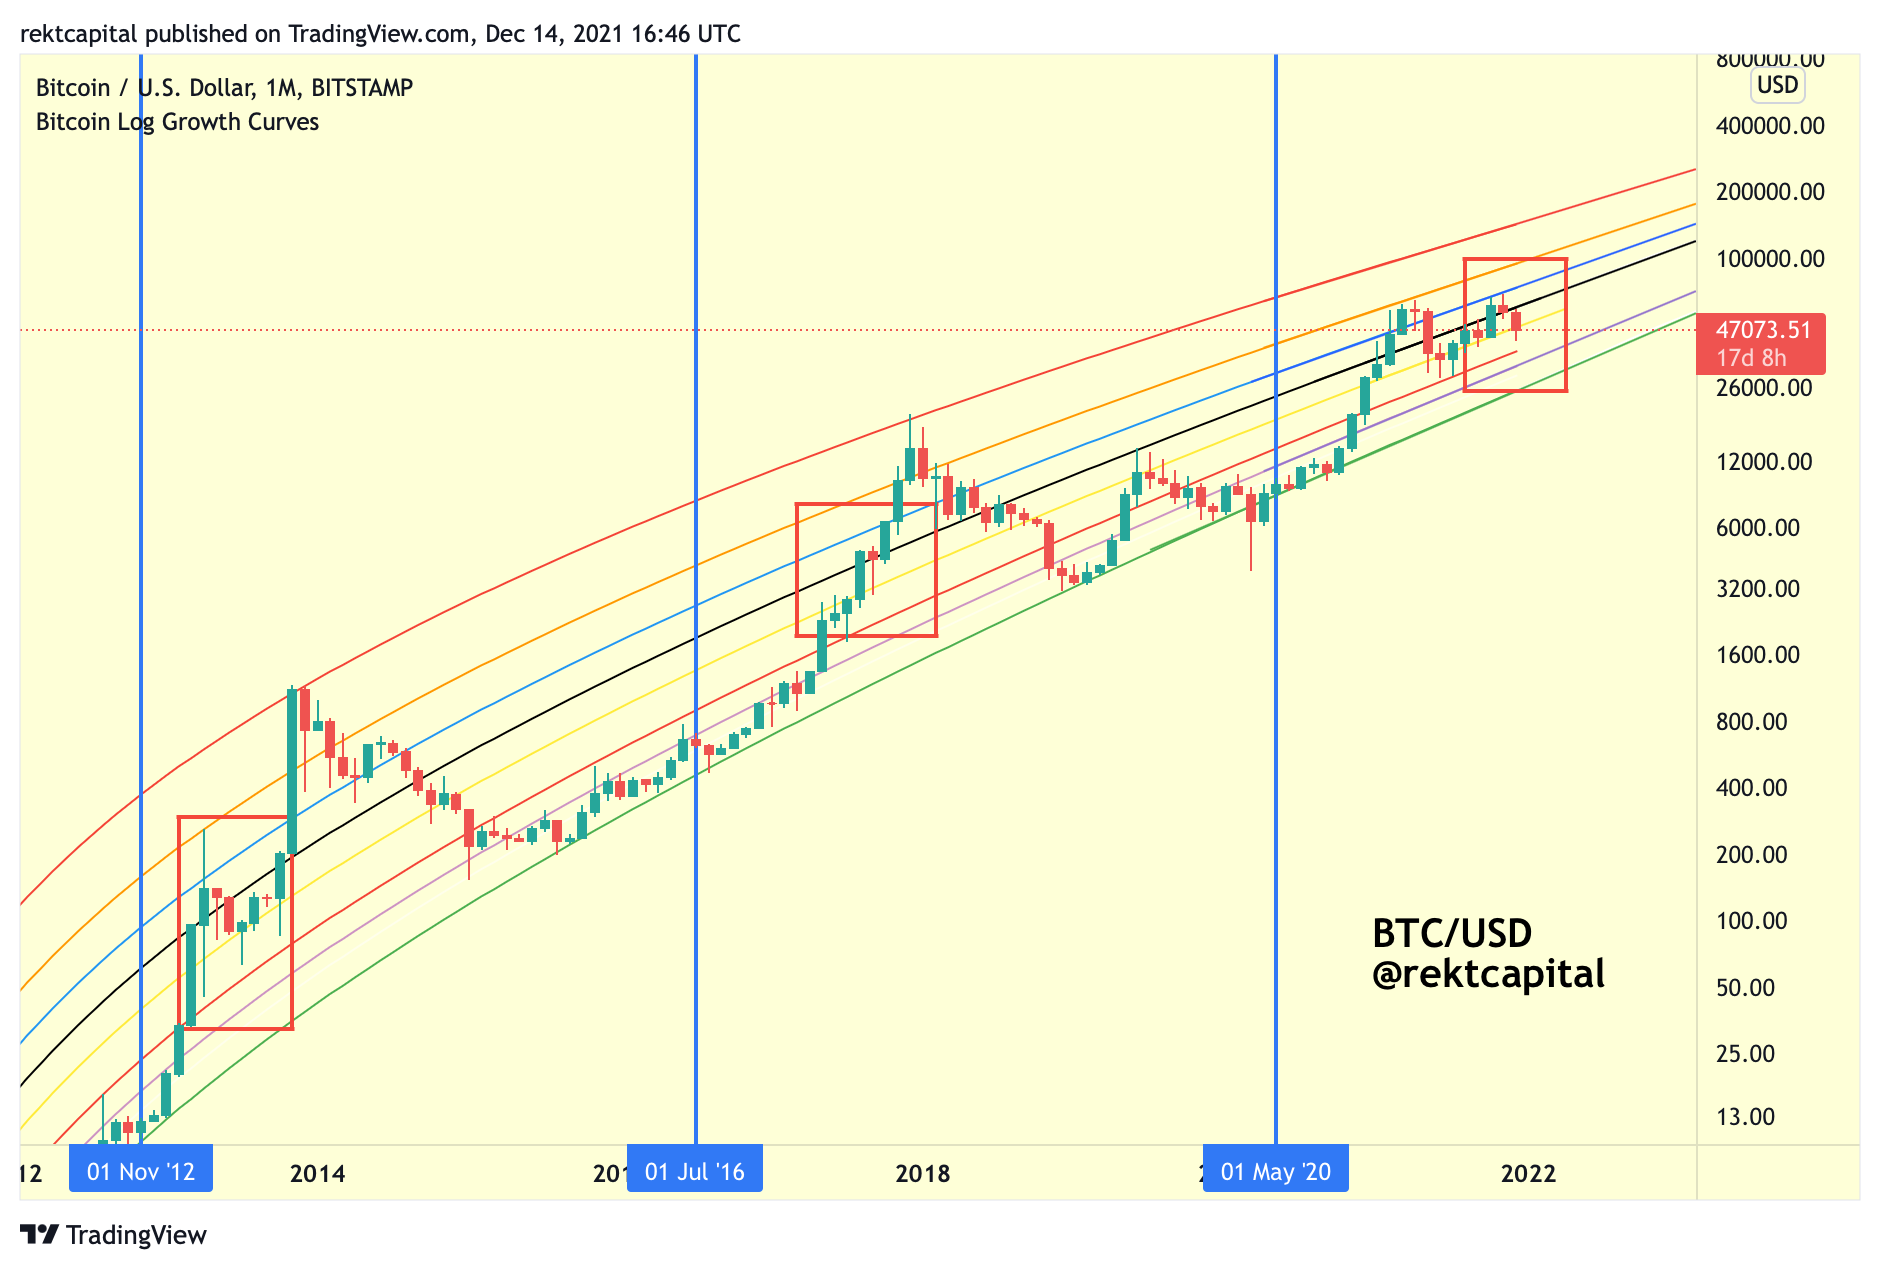
Right now, it’s all about BTC maintaining the yellow 0.382 Fib Curve as support, just like it did in 2013 and 2017:
Thank you for reading.
P.S
The NEW Rekt Capital course "Bitcoin Investing" launches later today!
Here’s how the course will help you:
• Understand when to begin de-risking your BTC investment as BTC nears its Bull Market Peak,
• Learn at what levels to increase or reduce Bitcoin exposure using key cyclical demand and supply areas,
• Gain deep confidence in navigating the Bitcoin market - no matter the cycle,
• Learn how to use different types of data science models to understand periods of maximum financial opportunity and periods of maximum financial risk,
• $50 discount for Early-Birds who Pre-Order (discount is already applied)
• And so much more.
This course is all about helping you make better decisions towards so that you can make money and most importantly - keep what you’ve made.
The Early-Bird offer includes a $50 Pre-Order discount and is now a limited-time offer.
Tomorrow, the pre-order period will end and the course will be priced $199.
Don’t miss out. Explore the new course now: