Welcome to the Rekt Capital newsletter, a resource for investors who want to better navigate the crypto markets with the help of cutting-edge crypto research and unbiased market analysis.
This Friday, I’ll chart your Altcoin picks in an exclusive subscriber-only TA newsletter and will cover as many as I can. So if you’d like to have an Altcoin charted, feel free to share max. two TA requests each in the comments below.
I’ll chart the Altcoins that get mentioned and ‘Liked’ the most. Let’s dive straight into today’s market analysis.
Altcoin Index Perpetual Futures
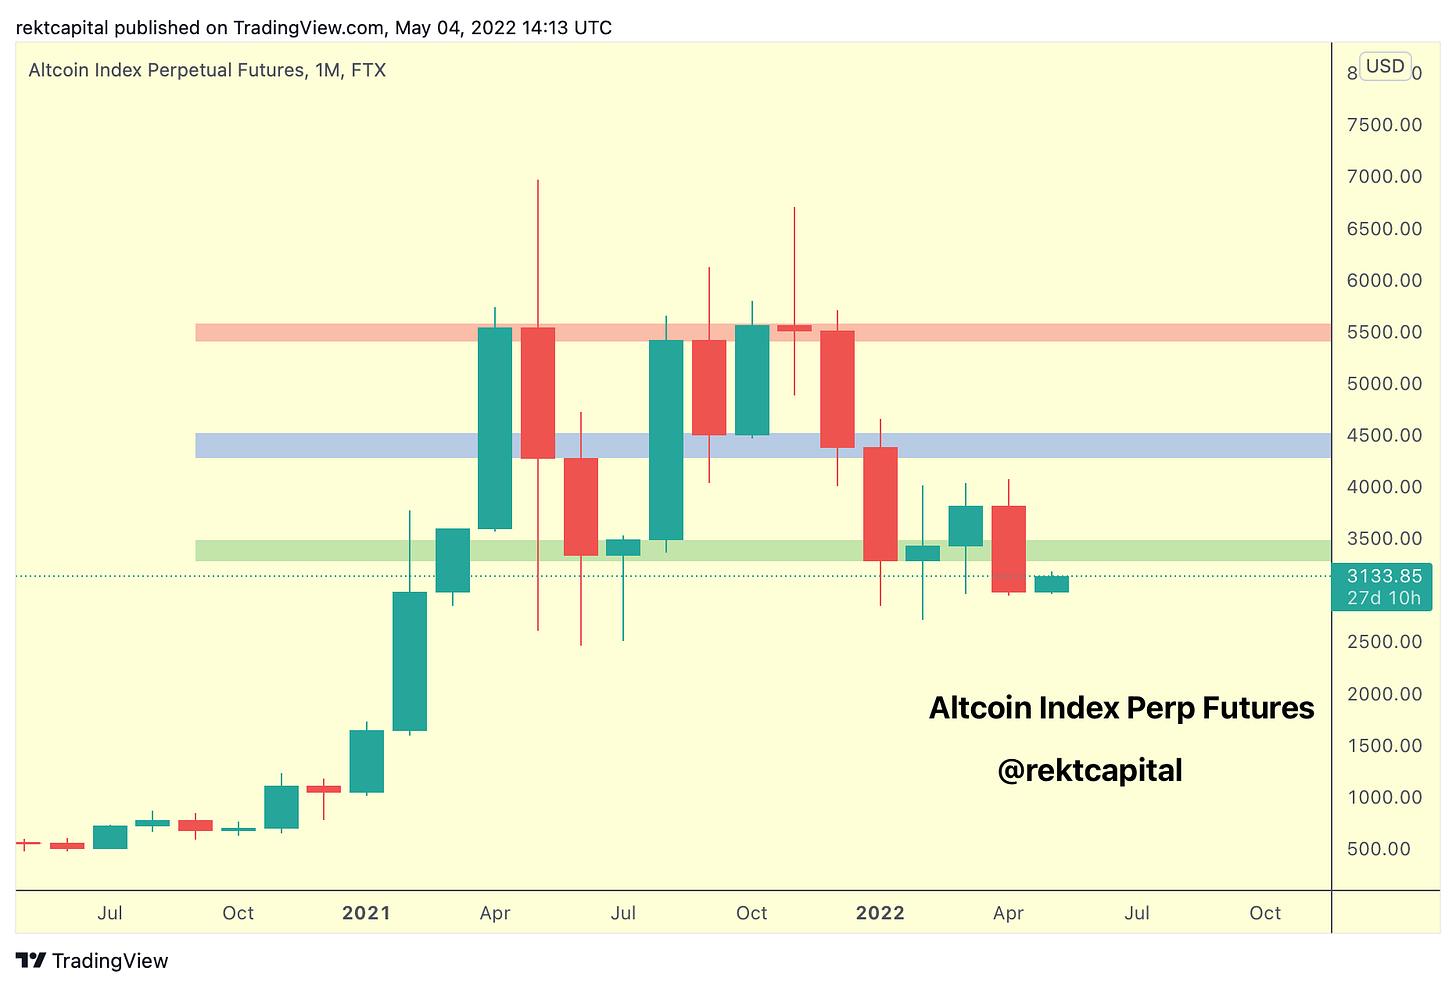
Altcoin Index Perpetual Futures is a useful metric that illustrates what is going on with Altcoins in terms of key levels.
In a sense, this is an aggregate of most Altcoins in terms of price behaviour.
Clearly, the Index is showcasing that Altcoins have lost a key Monthly demand area (green).
Let’s discuss this.
In mid-2021, the Index rebounded from the green demand area. The reaction there was very strong, as evidenced in the long downside wicks. This preceded a move to almost All Time High on the Index.
Now let’s juxtapose that period with this current period.
Earlier this year, the Index printed long downside wicks below the green area but to little fanfare; the Index bounced and lost support.
In fact, the Index may be flipping this same area into a new resistance.
Now the question is - was this a fake breakdown?
Or indeed has this demand area weakened so much in a matter of several months?
The weak reaction from green suggests that latter, but there is still scope for fake breakdown scenario simply because fake breakdowns occur in two steps:
Monthly Close below key level (in this case below green, which occurred)
Rejection from key level, old support, new resistance (hasn’t happened)
Therefore the Index has a good chance of climbing towards the green area but we need to be mindful that this may be a relief rally, unless the Index is able to reclaim green as support and ultimately Monthly Close above the area to confirm this reclaim.


