Welcome to the Rekt Capital newsletter, a resource for people who want to better navigate the crypto markets with the help of cutting-edge crypto research and unbiased market analysis.
Every Friday, I host an Altcoin TA session where I share my exclusive commentary on the price action of a wide variety of coins.
I share charts on 8 coins today.
In today’s Altcoin newsletter, I cover 8 different Altcoins, specifically:
Thorchain - (RUNE/USDT)
Polkadot (DOT/USDT)
Cardano - (ADA/USD)
Cosmos (ATOM/USDT)
Icon (ICX/USDT)
Algorand (ALGO/USDT)
Syscoin (SYS/BTC)
Zilliqa (ZIL/USD)
Thorchain - RUNE/USDT
Here are my thoughts on RUNE from this past Wednesday in the newsletter:
Here is an up to date chart for RUNE’s price action:
RUNE has successfully retested the green area as support, rebounding over +40% towards the red resistance area above.
RUNE has thus traversed the entirety of its green-red range.
RUNE will only be able to confirm further upside if it is able to reclaim the red area as support (via a Weekly Close above red, for example).
Until that reclaim occurs, RUNE risks overextension into strong resistance in the short-term.
Polkadot - DOT/USDT
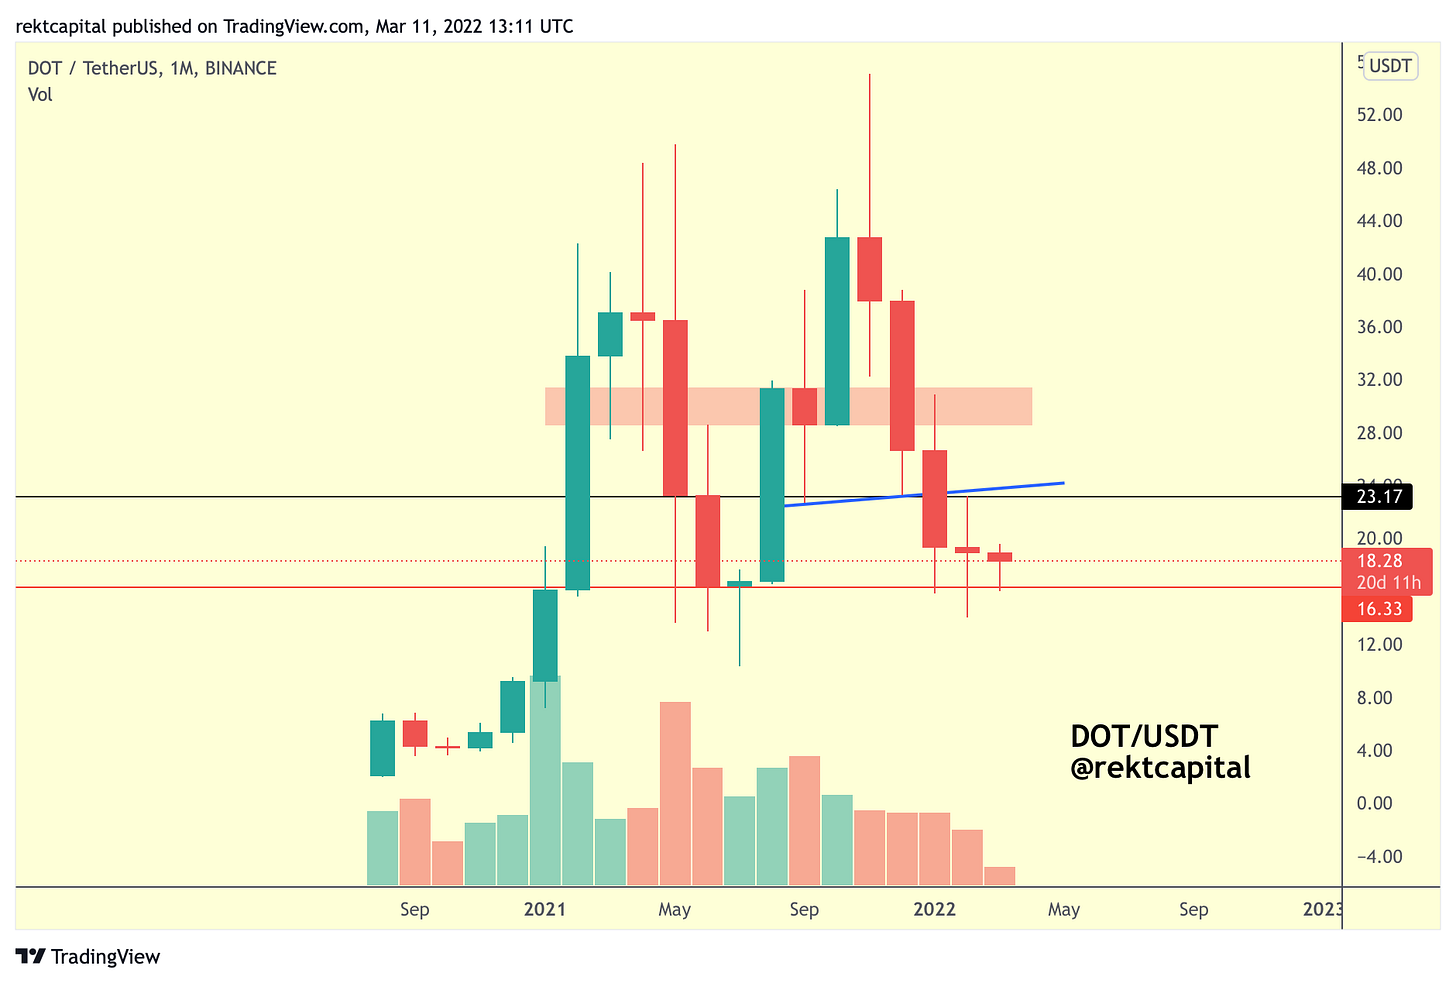
This is going to be a higher timeframe, supplemental analysis to what I’ve already covered this past Wednesday about DOT.
The red $16.33 support has been a key point of reversal for DOT, historically.
One the past 2.5 months, DOT has been printing long downside wicks against this red support, indicating at least in candlestick analysis possible slowing in the sell-side momentum.
But it’s not just candlestick analysis that is suggesting this; the volume bars also tell a similar story in terms of seller psychology.
For the last few months of late 2021 heading into early 2022, the seller volume was at a high but stable level.
Last month however, DOT experienced a notable shift in this sell-side volume; if seller volume turns out to be even lower than February’s, then DOT will showcase confluence across candlestick and volume analysis when it comes to seller exhaustion.


